|

The examples below illustrate how NonStop ASAP 3D availability vectors and state icons
correlate normalized color-coded availability stats and performance information.
Mouse over text below or in tree for examples.
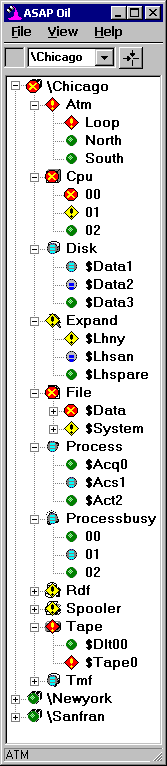
 ATM critical icon shows Chicago Loop ATM machine is low on
cash, $150 left. You can add more custom application entities via ASAPX API.
ATM critical icon shows Chicago Loop ATM machine is low on
cash, $150 left. You can add more custom application entities via ASAPX API.
 Cpu down icon shows Chicago Cpu 00 is down. Color-coded state information
is also propagated to tree, graph and grid views.
Cpu down icon shows Chicago Cpu 00 is down. Color-coded state information
is also propagated to tree, graph and grid views.
 Disk high utilization icon indicates
that disk volume $Data1 is 87% full.
Disk high utilization icon indicates
that disk volume $Data1 is 87% full.
 Expand warning icon indicates that Expand line handler $LHNY
is trying to connect.
Expand warning icon indicates that Expand line handler $LHNY
is trying to connect.
File down icon indicates that
file \Chicago.$Data.Account.DB is missing.
Process high use icon indicates that process \Chicago.$ACS1
has a receive Q of 8.
ProcessBusy high use icon indicates that the query process
$QP is 73% busy.
RDF warning icon indicates
that the RDF Updater process $UP01 is 120 seconds behind.
Spooler warning icon indicates
that the Spooler Collector is 93% full.
Tape critical icon indicates that tape $TAPE0 has been
waiting on a mount for 17 minutes.
TMF high use icon indicates
a transaction has been outstanding for 345 seconds.
OEM view provides a sorted list of
alerts prioritized from highest to lowest alert levels. Includes Enterprise
Management interfaces.
|